Machine learning is useful but not new. Many fields have used it for many years, but they give it another name. It is called in the field of chemical measurement and calibration of multi-channel measuring instruments multivariate Data modeling It has been used, for example, in the food industry for several decades. This technique is now being further developed for continuous analysis of technical big data, among others by the Big Data Cybernetics group in NTNU’s Department of Technical Cybernetics, where work is being done to embed both physics-based and data-based modeling in the field of subscriber.
This kind of hybrid modeling is general, but it is particularly suitable for big technical data, such as automatic thermal video analysis. The purpose is to give engineers and operators good tools for safer and better operation of technical equipment or industrial processes – tools that are transparent and understandable.
Technical machine learning can capture systematic patterns of variance in large data streams, separating them from random noise and transient measurement errors and making them explainable to humans. The basic idea is similar to the human experience of music: from the cacophony of signals flowing from a multi-stringed instrument, or an entire orchestra of instruments, we hear Basic Rhythms and Harmonies during their flow. And when you learn what sounds good, you can also detect noises — like coughs and fire alarms.
Here we demonstrate this kind of explainable machine learning with an example of remote monitoring of a large diesel engine under variable load, using continuous thermal video analysis.
Continuous thermal imaging from a fixed camera
A thermal video camera that monitors a process or technical equipment can provide very informative telemetry from tens or hundreds of thousands of “thermometers” (pixels) positioned spatially many times per second, year after year.
With the technology described here, the information content of this technical big data can be interpreted and used, in real time and over long time horizons, using modest hardware. Not all machine learning can, or should, be run in resource-intensive server pools.
The measured temperature can be interesting in its own right, eg for smelting processes, biological sterilization processes, etc. But continuous thermal video data can also react indirectly to hidden changes within engines, blast furnaces, refrigeration equipment, tanks and pipelines as well as electrical equipment. This may be due to desired electrical or chemical processes, for example in metallurgy, combustion and other endothermic and exothermic reactions, or internal agitation and degree of filling. or unwanted friction, conductivity, and changes in the goods’ thermal conductivity, heat capacity or surface properties, as well as gas and liquid leakage.
Thermal monitoring of the internal combustion engine
Figure 1 shows thermal camera monitoring of a powerful diesel engine combined with interpretable machine learning. The results shown are based on a commercial pilot project in Norway, but have been anonymized and slightly modified for educational reasons.
This continuous video stream represents a large amount of data that quickly fills up the memory of an ordinary computer. But Figure 2 shows how a real-time continuous thermal video stream can be processed into the autoencoder algorithm, which detects and describes Patterns of material difference In measured thermal video – in time and space:
First, contrast pattern #1 is detected, which is described by the product of the spatial pattern image (“its harmony”) and a simple state variable in time (“its rhythm”). All subsequent images are modeled by projecting onto this pattern image, so that this #1 time series gets longer and longer.
After a while, a new contrast pattern, #2, was detected in the video stream, and then later also another variation pattern, #3, each of which is a product of the spatial pattern image and temporal state variable. Like divergence pattern #1, these detected patterns are also quantified from now on in each new image.
Continuing, new combinations of the same three detected typical images explain most of the temperature changes, both with and without a heavy load on the engine. But if new patterns of variance—expected or unexpected—emerge later, they too are automatically detected and included as a small extension of the linear x-space model. This automatically generated thermal model slowly grows in complexity – but only as needed. The model is kept as simple as possible.
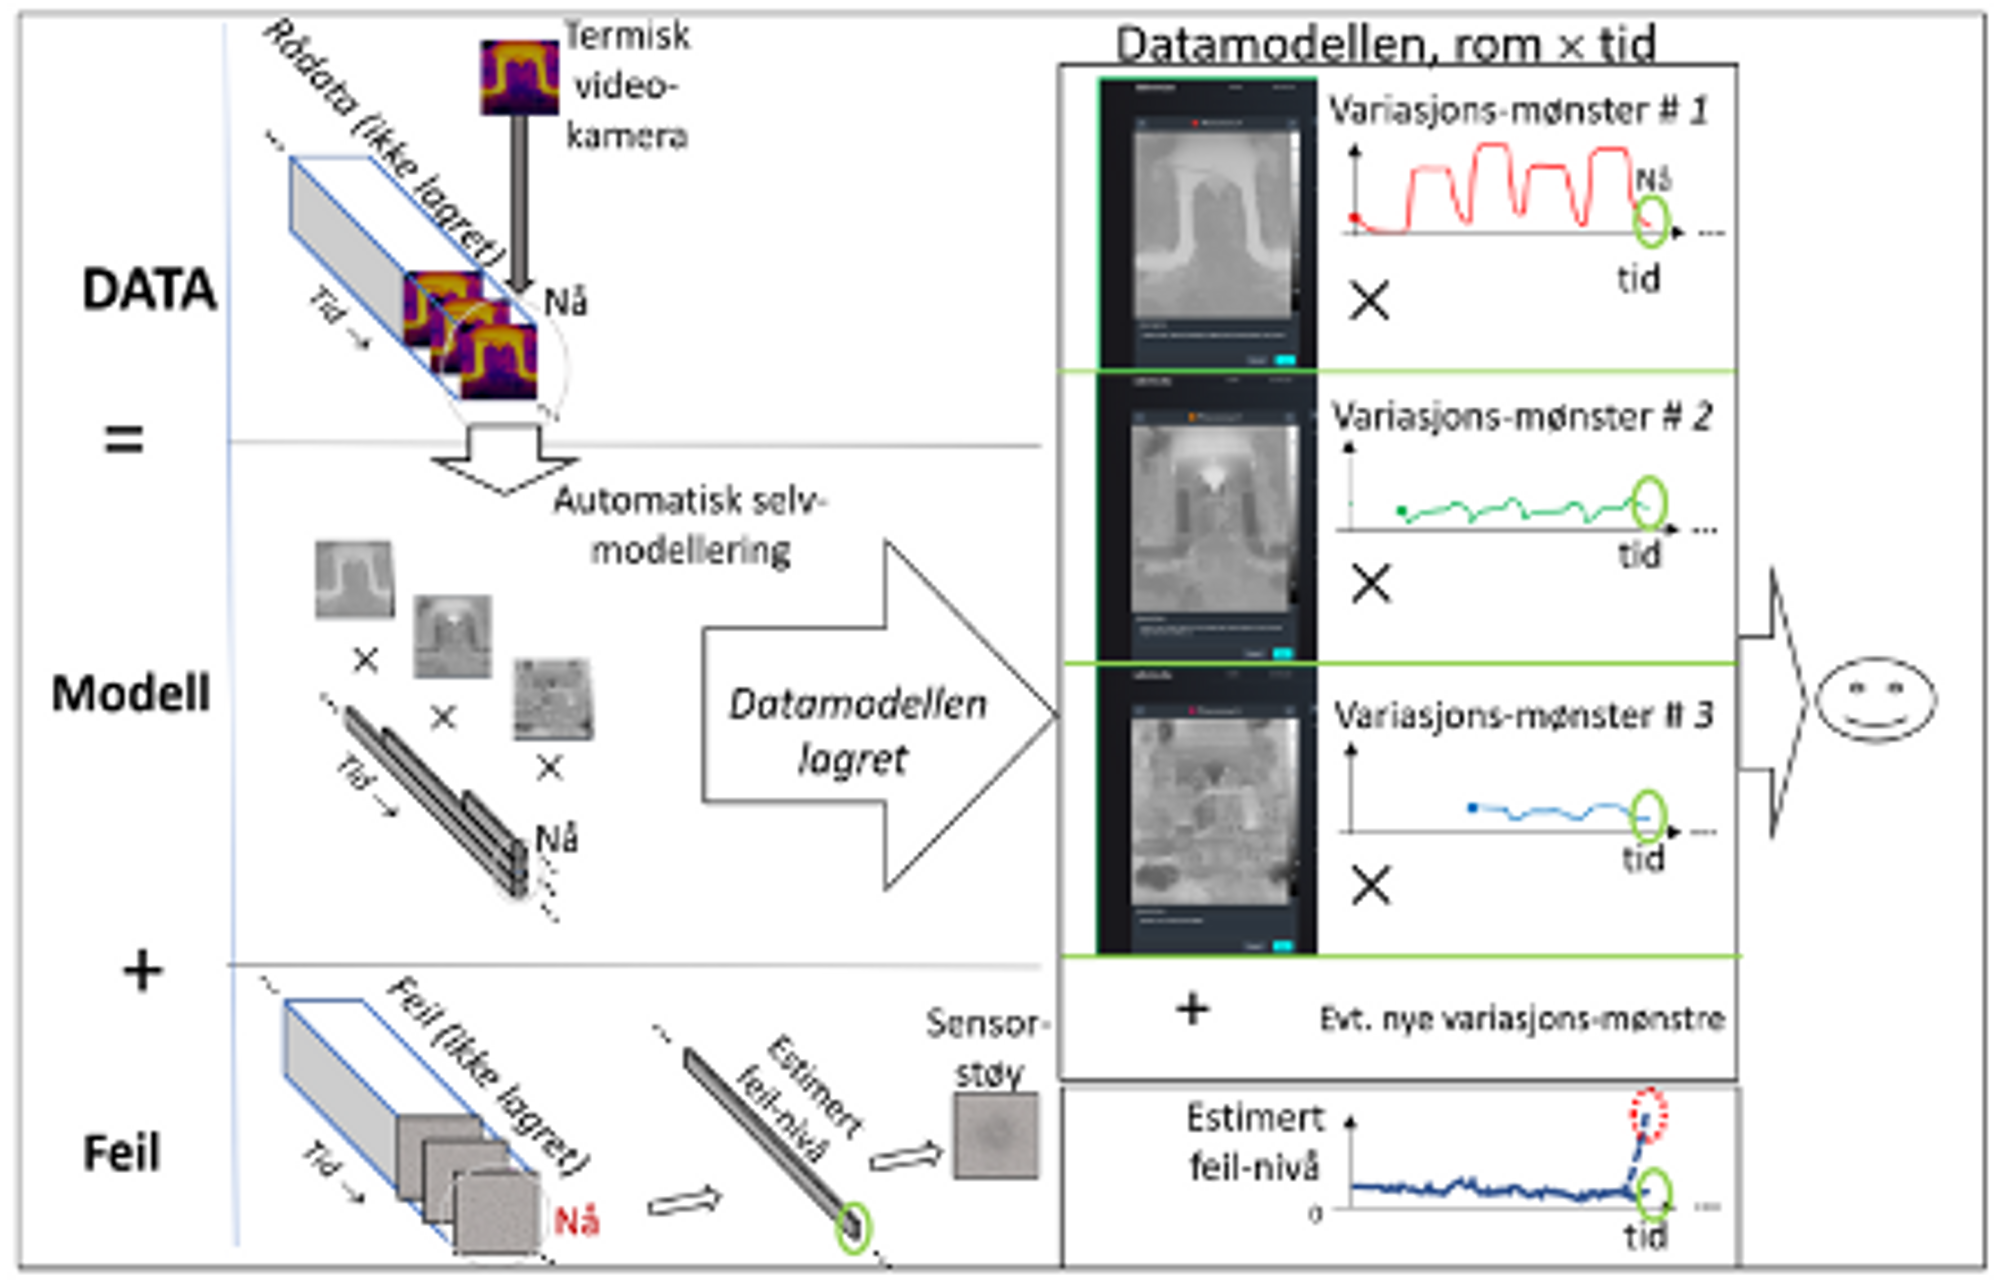
Thus the video image stream is designed as one Sum of patterns of systematic divergencewhere each pattern is modeled on a shape x spatial pattern image time series (state variable).
When a new thermal image is emptied of its systematic space × time variance, non-model image errors (noise, etc.) are summed up to improve the statistical model. Abnormal error images provide real-time error notification and can be stored for later analysis. But then both the thermal image and the jamming image are deleted from the computer’s memory. The only thing that is preserved is the compact model, which consists of (a few) pattern images and their associated state variables, as well as an estimate of the general noise level in time and space.
But after a long time, even this greatly reduced space x time model grows into a large amount of data. So it is also stored away, at intervals. Consequently very compact space x time model, the entire video sequence can be reconstructed at any time, apart from uninteresting scaling noise, which is difficult to compress, and any abnormal deviations.
Keep the human in the loop!
Overview of the actuator: In the upper part of Figure 3, the measured and reconstructed temperature image (the sum of the time × space patterns) and the error image are illustrated – slightly stylized – for a normal and an abnormal actuation moment. Refactoring can be used to visualize the process for operators in real time, as if they were watching it with their own eyes. Such a perception can nullify alienation. In this application, operators were forbidden to stay near the machine during operation for safety reasons.
The error image provides automatic notifications if unexpected patterns and trends are detected. Then people with experience should consider: Is this a new but harmless thermal change pattern that can be built into the model for future generations? Or is there something unexpected and frightening that requires an immediate emergency stop: a gas leak, a crack, or lack of cooling?
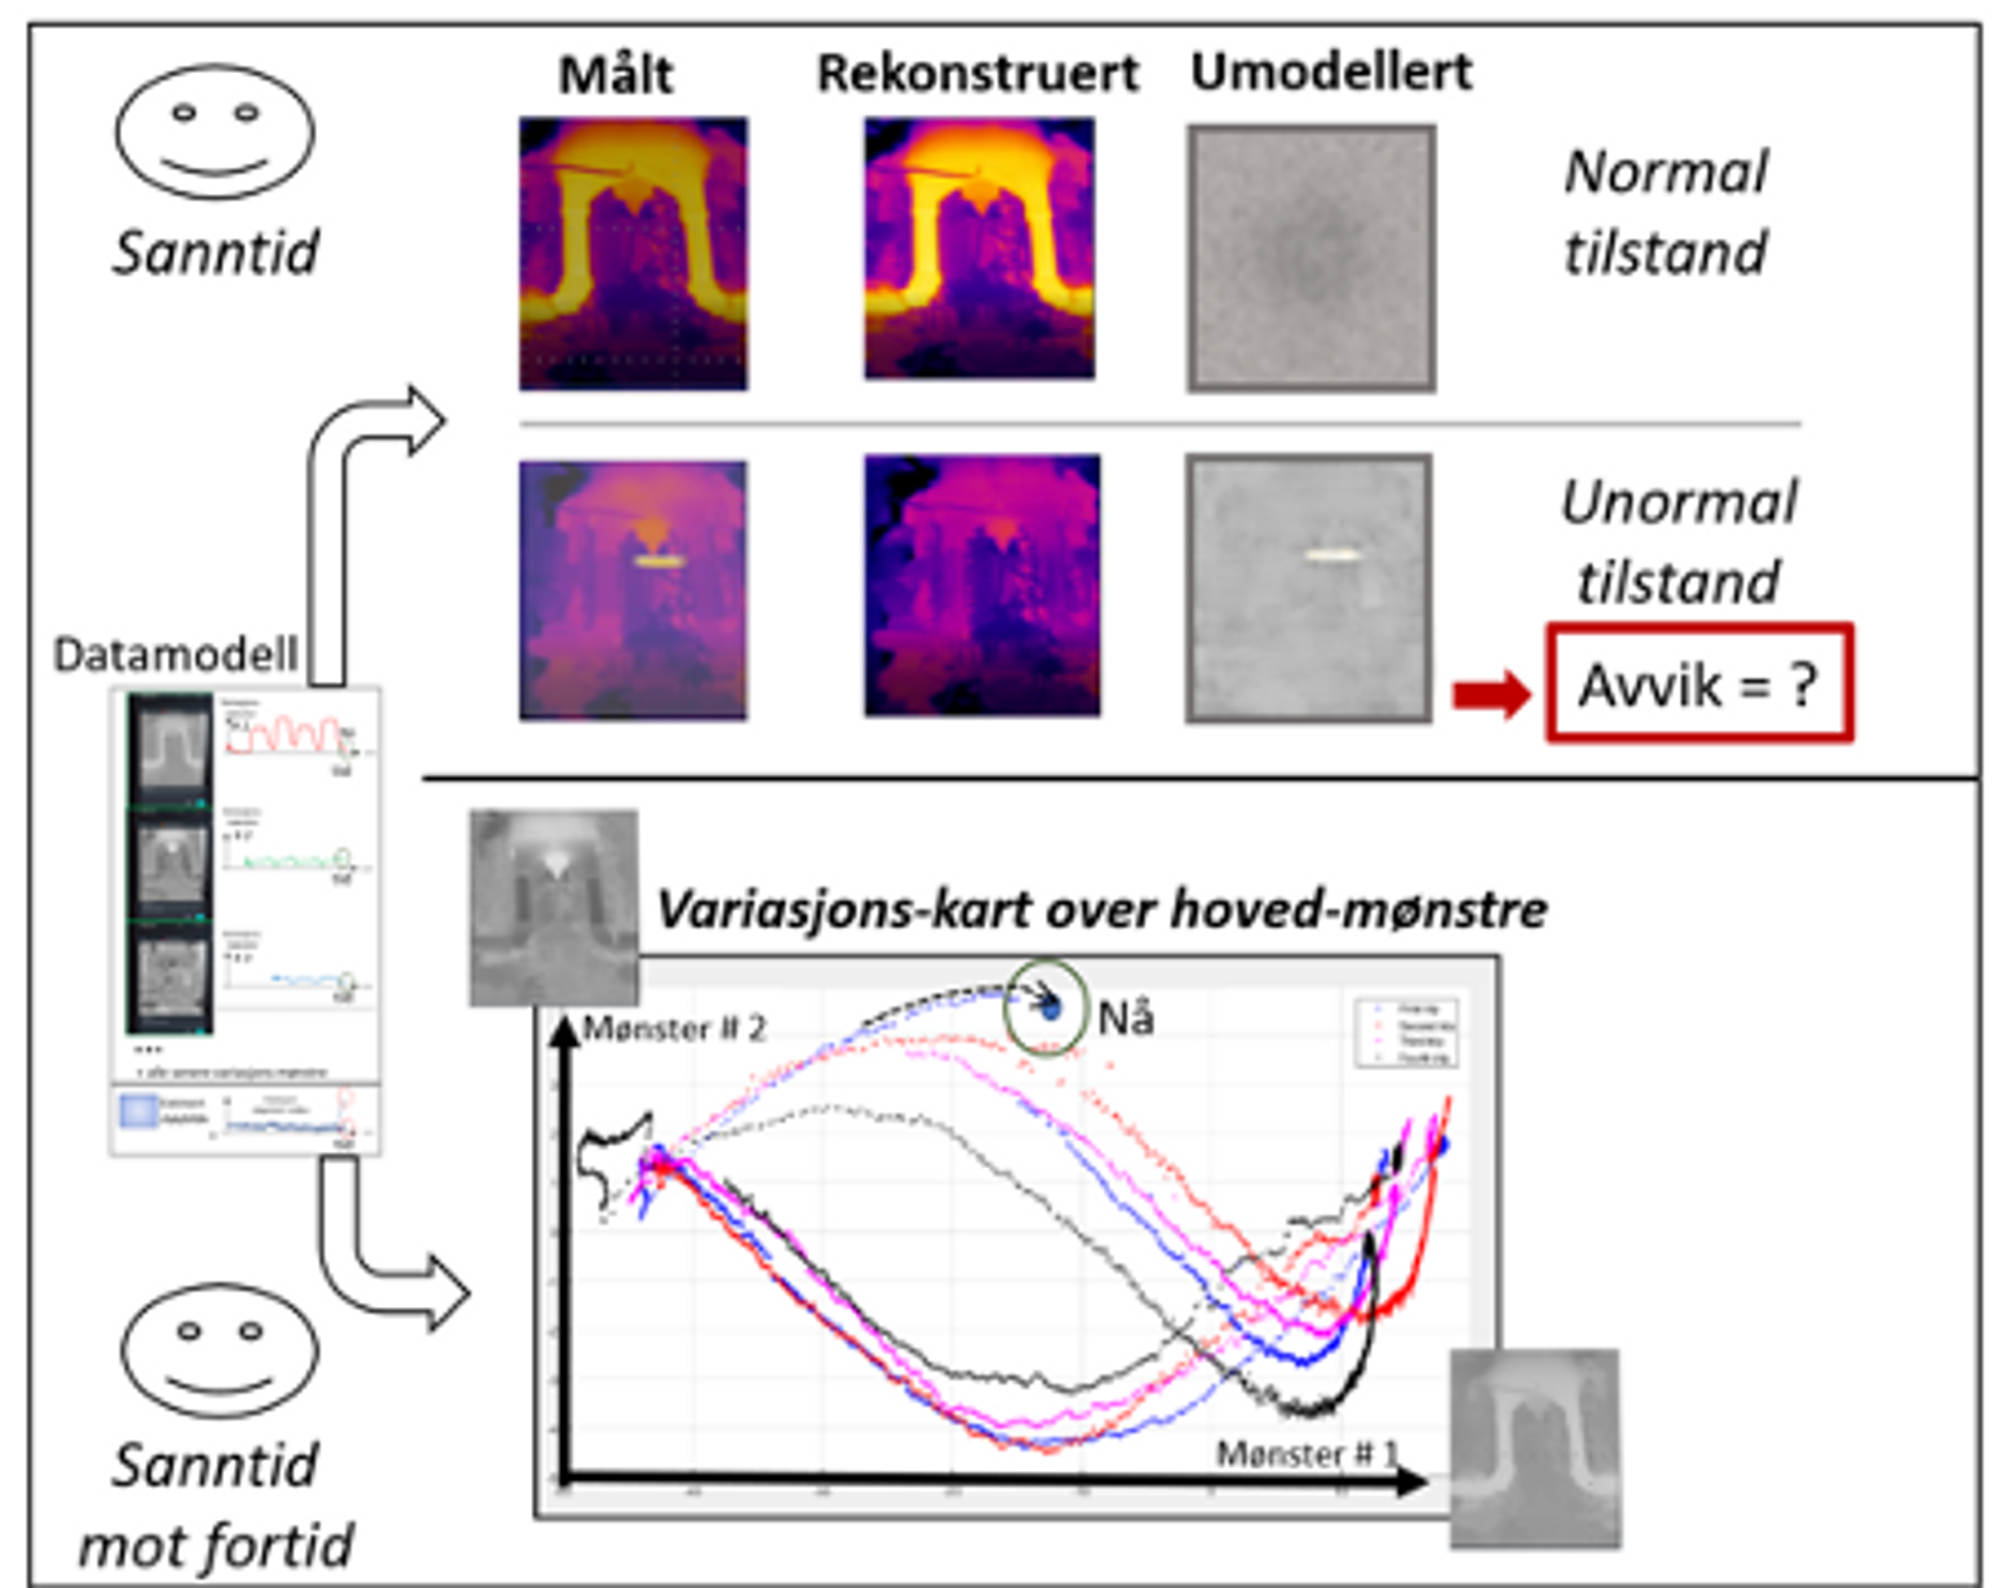
Expert overview: As shown in the lower part of Figure 3, one can also map the process over a longer period of time, without being overwhelmed by the amount of data. Here the first two contrast patterns are plotted against each other, with each point representing one point in time, including the “now” point of all times.
This master map shows how the diesel engine followed similar spatio-temporal trajectories during repeated starting and running, for the first two variation patterns. However, the figure shows a slow pattern process when the diesel engine load is ramped up and down repeatedly over a longer period of time.
Limitations and possibilities
In complex applications, where data is affected by Many unknown causesis today black box Perhaps machine learning from artificial intelligence is necessary — for now. But it places high demands on both training data and error notification. For many types of big technical data, this is unlikely Exaggerate.
Two-line eigenvector modeling is best suited for systems with a limited number of systematic causes of change, in addition to random noise and any abnormal changes. Many technical systems are like this. Then this physical machine learning is an advantage, especially if you want to understand what’s going on.

“Explorer. Unapologetic entrepreneur. Alcohol fanatic. Certified writer. Wannabe tv evangelist. Twitter fanatic. Student. Web scholar. Travel buff.”