According to the latest news Production numbers from NVE (2021) There were then 64 wind power plants in Norway with 1,304 turbines and an installed capacity of 4,776 MW. They produced the total 11.8 TWh. In comparison, we had 1,749 operating hydroelectric power stations with a combined production of 33,611 MW, with an average annual production of 38,330 GWh, and their annual production is estimated at 137.9 TWh. Hydropower is quite dominant and accounts for 92.1 percent of Norway’s energy production, and wind turbines’ share of the total was only 7.9 percent. not much.
Since then, there have been a few more wind turbines, and per date (06.03.23), NVE states there are a total of 1,368 turbines with 5,083 MW of installed capacity, but actual production figures for 2022 are not yet available. It is unlikely that these turbines will change the overall picture much: it is clear that hydroelectric power will be the most important source of energy for the foreseeable future.
Wind turbines use only a third of their capacity
Wind power varies with weather and wind: there is geographic variance – where the wind blows in the country, change over time – hours, days, weeks, months, and there is variance from year to year with respect to geography and time. This means that there are significant differences in energy production, and this difference must be looked at closely.
NVE has good data on this. Two things are particularly interesting: production data and service life. The production data shows energy production at different levels of time – per day (MWh), per month (GWh) and per year (GWh) for all wind power plants in Norway.
The usage time shows the number of production hours at full load per year. NVE calculates time-of-use by dividing historical production by the installed capacity at individual wind power plants. Another goal is capacity index per year, which is specified as a percentage, that is, the usage time in hours divided by the number of hours per year. The capacity-per-month factor can also be calculated: production per month divided by the installed capacity per power plant. This number is then divided by the number of hours in each month.
If windmills are running at full capacity all the time, the capacity factor will be high. If they stand for periods, or walk slowly, the factor becomes low. So the ability factor is a good indicator for runtime The efficiency of wind turbines as energy producers. Thus, high uptime means high and stable power output, and low uptime means the opposite.
In Figure 1, I present the average operating time in percentage of all Norwegian wind power plants in 2019, 2020 and 2021 compared to the operating time of the hydroelectric power plants at Sira-Kvina kraftselskap in the same period – one of the largest hydroelectric power producers in the country.
Most striking is the low operating time of wind power plants, ranging from 32.5 to 37.4 percent. The average operating time of wind turbines was in these three years 34.5 percent. They don’t go “half machine” at once and only use an approx. One-third of the installed capacity per year. This is in contrast to the water turbines at Sira-Kvina, which run almost all the time, the runtime here is between 94.3 and 99.9 percent, on average. 95.8 percent. Not only is the output high, but it is also stable, predictable and safe. Therefore, the difference in availability, stability and productivity between wind energy and hydro energy is very large. This means huge differences in energy security.
Wind turbine energy production varies greatly throughout the year
Figure 2 shows the availability in percent per month for four regional wind power plants in 2021. The power plants were selected according to geographic criteria: Southern Norway (Lysta), Western Norway (Midtvelet in Fitjar), Central Norway (Rouen in Trøndelag) and Northern Norway (Kvitvill). in tromes).
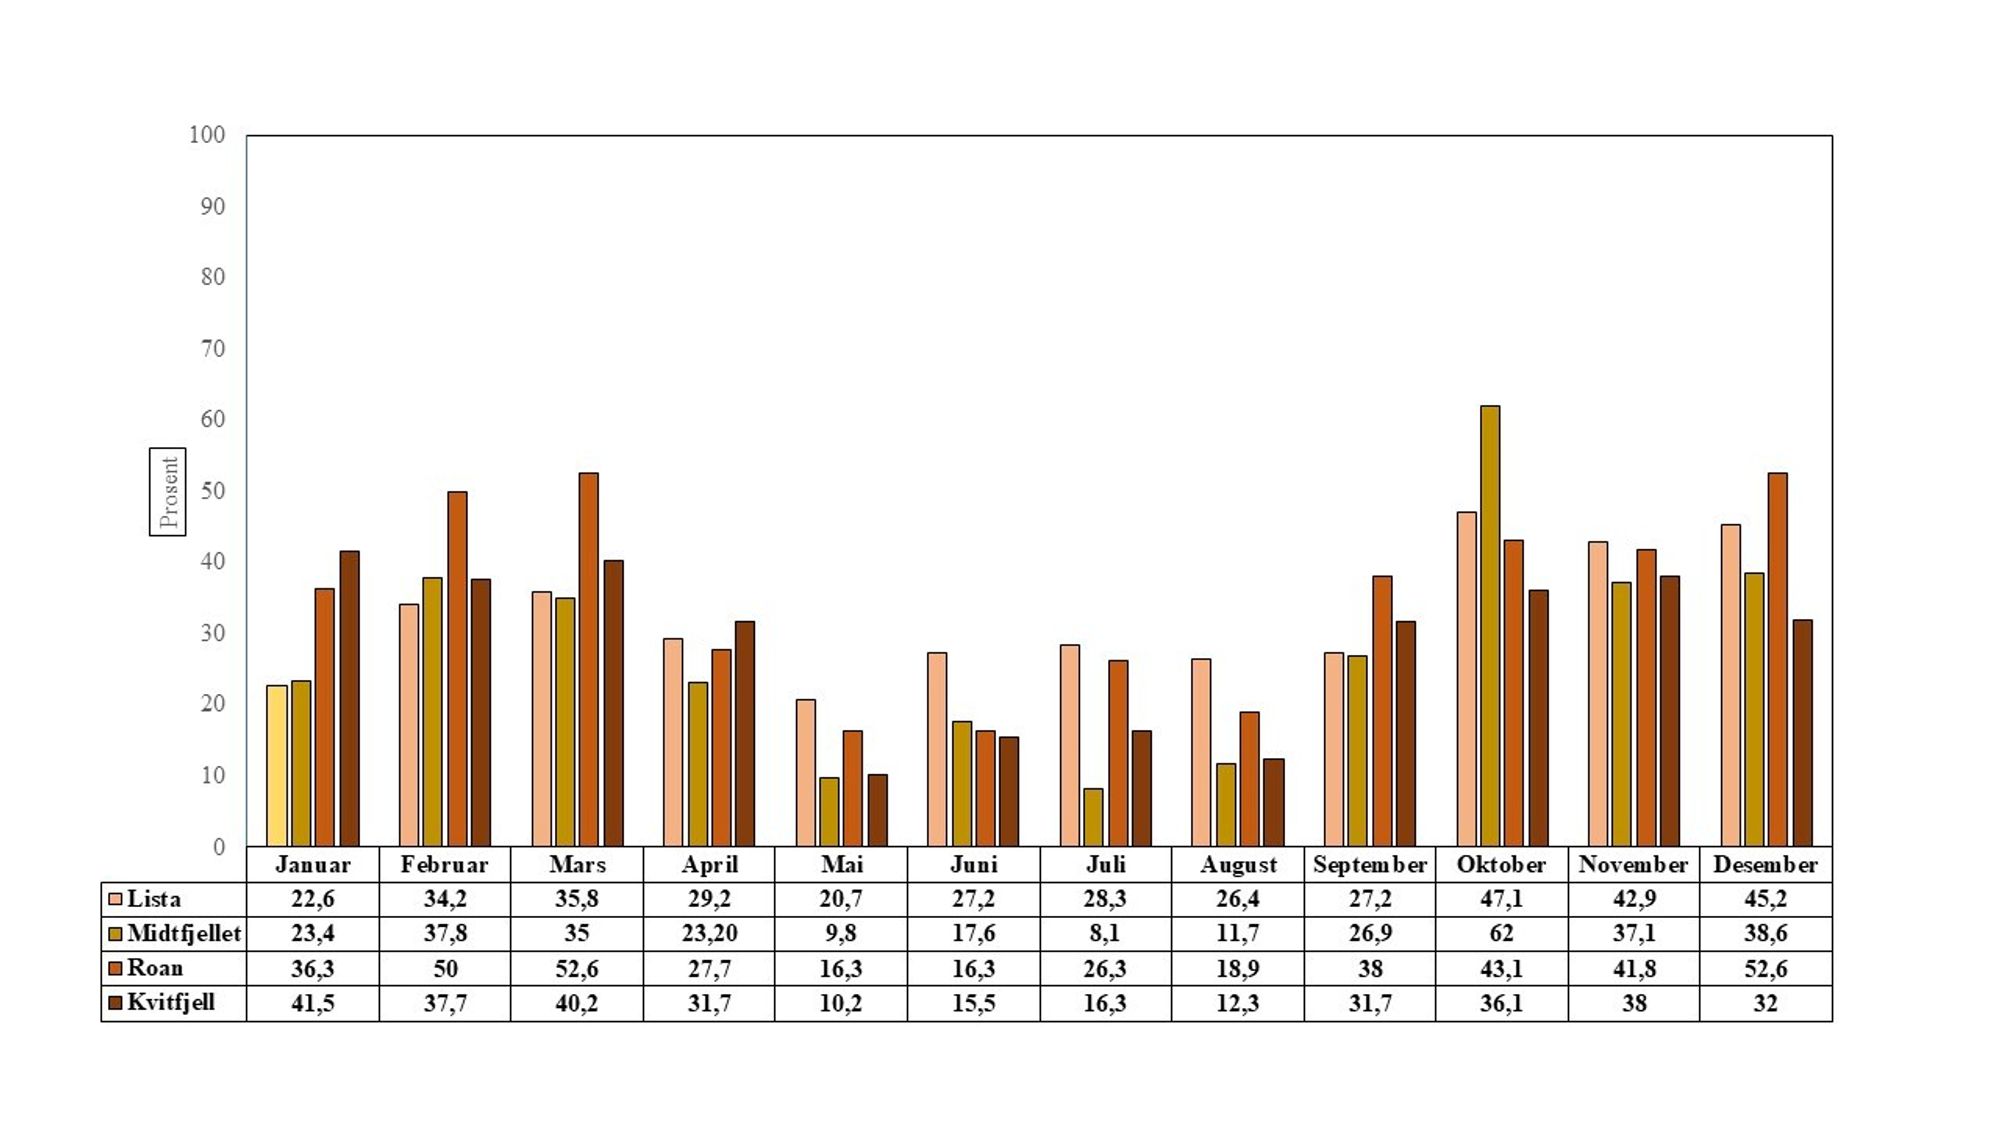
There is a large variation in operating time over months for all four wind farms. Production was lowest in May, June, July and August, and highest in February-March and October-December. There was some regional variation. Midtfjellet in the municipality of Fitjar had the lowest uptime at 8.1 per cent in July. Kvitfjell in Troms also recorded low figures in spring and summer, with 10.2 percent in May and 12.3 percent in August. Midtfjellet achieved an all-time high uptime in October with a score of 62 per cent. It was the average operating time over the year for the four wind power plants 30.9 percent (SD = 12.6), 69.1 percent In other words, of the installed capacity was unused. This also agrees well with the national picture shown in Figure 1.
Table 1 below shows the variance in operating time in more detail for each of the four wind power plants over the course of the year.
Table 1. Variation in operating time for the four wind power plants in 2021
|
Power plant
|
middle
|
minimum
|
Maximum
|
SD
|
|
existing
|
32.2
|
20.7
|
47.1
|
8.8
|
|
Midtfjellet Fitjar
|
27.6
|
8.1
|
62.0
|
15.5
|
|
Brown
|
35.0
|
16.3
|
52.6
|
13.7
|
|
Caviteville Thermos
|
28.6
|
10.2
|
41.5
|
11.6
|
The numbers aren’t particularly surprising, they just reflect unpredictable natural changes in winds over time — and that’s the problem. They show how energy production from wind turbines is low, unstable, unpredictable, and uncertain, in contrast to hydropower production.
Energy company Sira-Kvina had a runtime in 2021 94.3 percent, In other words, high, stable and predictable electricity production. The difference is amazing. In other words, wind power plants violate a very basic premise in national energy production: stability, predictability, and safety. We have to ask ourselves: Why invest so much technological and financial resources in such a weak and unstable producer of energy – which is also responsible for the greatest destruction of nature and the environment in Norway’s history? There are other options.
“More power” and the size problem
Some politicians and LO/NHO’s scream “more power” and “renewed”. Then they mean more wind turbines on the ground, but they don’t get it scale problem: Industry and lobbyists try to portray wind energy as very important to climate and future energy needs, but many energy factors need to be seen in context and not all of them are equally important.
In the big picture, wind energy means little, about 10-15 percent of national production. Hydropower means the most. Wind turbines also have no climate impact. Annual electricity consumption in Europe is about 3,300 TWh, and 37 percent is produced from fossil energy (oil, gas and coal), which is 1,221 TWh. Even if all of Norway’s wind energy were exported to the EU to cover fossil energy, 10-15 TWh would have no impact (1.2 percent with 15 TWh). Moreover, our wind energy does not go there, it is used here. On the other hand, with a sea wind, the picture can be completely different.
Obviously, windmills have one Visual code function For many because of the high social visibility, the image of climate-friendly “green” energy (but a “red cloth” for wind energy opponents). There are smarter measures than wind turbines to meet future energy needs. more Clever use More force is more important than “more force”. There are three actions mentioned here that can make wind turbines redundant (Energy Authority and Sintef):
- Technical renovation of hydroelectric power stations (8 TWh)
- Use of excess heat from the Norwegian industry (20 TWh)
- Stop shelf electrification and use the energy locally (13 TWh). Norway is the only country in the world that uses it Renewable energy for fossil energy production The climate of political absurdity. The shelf must contain gas-fired power plants, among other things, for emergency reasons. There is no work for the Russians or others to cut the electric cables, and then production will stop at the Johan Sverdrup field. Gas power plants are safer against vandalism. The EU has now approved gas as a “green” source of energy under certain conditions, although this is a matter of internal debate.
Only these three measures will add up 41 terawatt hours In power, it is much more than windmills. Then comes energy production that is not mentioned here (offshore wind, small power, solar) and in addition we can provide 15 TWh with energy efficiency in buildings. Many other energy saving measures are also relevant. All of these measures can be implemented quickly – if the government wants to. So we don’t need windmills.
Harmful effects of wind energy
Not only does variable wind energy play a small role in the green transition, but it also has a number of harmful effects that need to be “subtracted”. Seven are listed here:
- Huge land uses. KS/Asplan-Viak has calculated land use for 88 permits and these require 1,760km2. This is more than all Norwegian cities and towns (1,138 km2) and all industrial areas (168 km2) together. There is a mismatch between land use and energy production.
- Land use may contravene the new Nature Convention that Norway has ratified.
- Violation of a Sami right to practice reindeer herding culture (Fussen case).
- Home depreciation, vacation homes and homes.
- Visual pollution (rotor movements cause visual ‘restlessness’ and discomfort in still landscapes, visual shimmer, shadow casts, flashing red lights on masts in the evening and at night), auditory pollution (noise), chemical pollution (use of glycol to clean ice from rotors, turbine oil leakage to nature) and safety problems (ice thrown from turbines, fire in turbines, etc.).
- Wind turbines can emit carbon dioxide2 and methane stored in swampy areas with wind turbines, roads and power lines. Only then is the green “profit” likely to rise in the yarn.
- Unknown property. Many wind farms have anonymous foreign owners registered in tax havens. Norwegian wind energy has become part of a global financial industry, because concessions and wind farms can be bought and resold at good returns – a pure financial investment. Energy production as such is secondary.
Conclusion: The power output of land-based wind turbines is so small and unpredictable that crying out for “more energy” and “renewable” is the wrong answer. Nature and the environment have been severely damaged, and anonymous financial “wind barons” are being created in tax havens. Wind energy is also a great power Environmental psychological challenge, not least because of the brutality with which many projects (Haram, Froya, Fussen, etc.) have been carried out. In addition to destroying landscapes and nature, this has created conflicts and disagreements and reduced the level of well-being and quality of life in many municipalities. It also has health consequences for many.
These things don’t just go away on their own, they just go on. Without wind turbines, we wouldn’t have these problems. Can we avoid this by investing in smarter solutions than wind turbines of the future: technical modernization and nature-friendly development of hydroelectric power plants, energy savings, solar power, micro power, offshore wind – and maybe eventually nuclear power?

“Web specialist. Lifelong zombie maven. Coffee ninja. Hipster-friendly analyst.”